


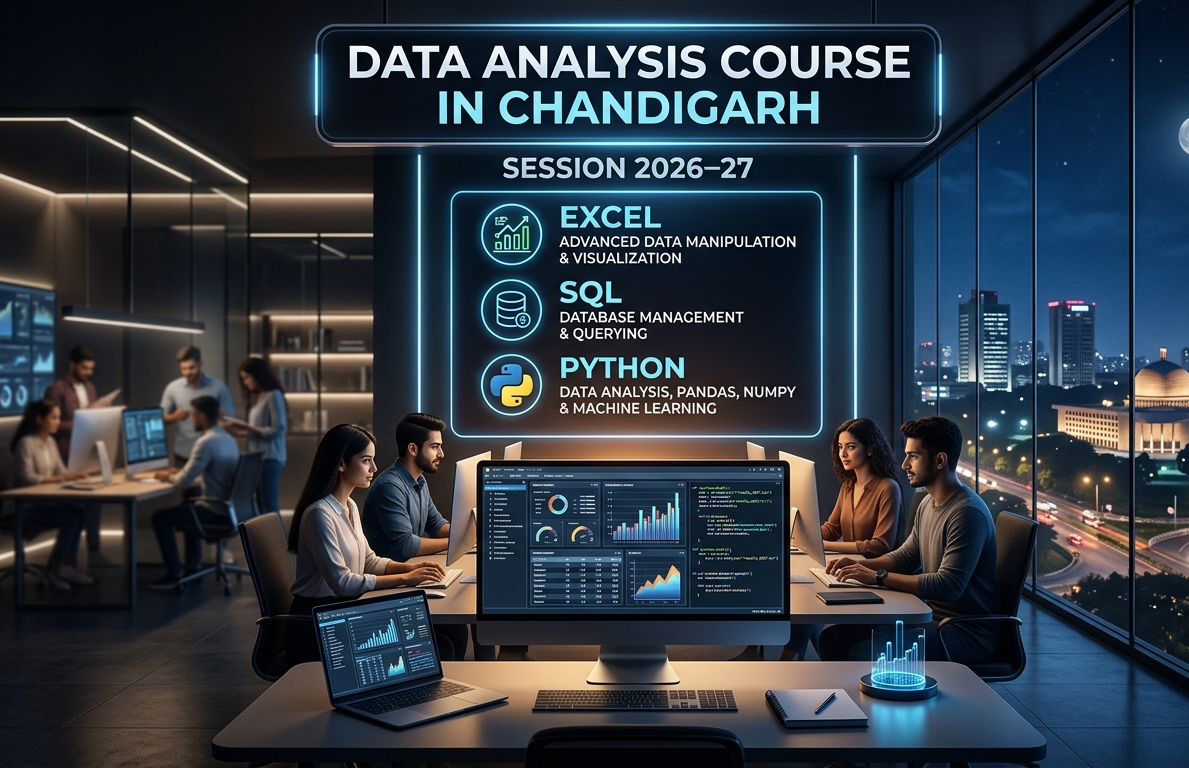
Data Analysis Course in Chandigarh — Excel, SQL, Python 2026–27
Introduction
Data has become one of the most important resources in the modern digital world. Every day, businesses, websites, mobile applications, hospitals, banks, educational institutions, and government organizations generate massive amounts of data. This data may include customer information, sales records, website traffic, financial transactions, employee performance, marketing results, and much more.
However, collecting data is only the first step. The real value comes from understanding that data and using it to make better decisions. This is where Data Analysis becomes important.
Data Analysis is the process of collecting, cleaning, organizing, exploring, and interpreting data to discover useful patterns, trends, and insights. Organizations use Data Analysis to understand customer behavior, improve business performance, reduce costs, increase sales, and make data-driven decisions.
As businesses continue to adopt digital technologies, the demand for professionals with data skills is expected to remain strong in 2026–27 and beyond. Students and professionals who want to enter the analytics field need practical knowledge of industry-relevant tools.
A Data Analysis Course in Chandigarh can help learners develop these important skills. The core technologies generally include:
-
Microsoft Excel
-
SQL
-
Python
-
Data Cleaning
-
Data Visualization
-
Statistics
-
Business Analysis Concepts
-
Real-World Projects
Excel, SQL, and Python are three of the most important technologies for building a strong foundation in Data Analysis. Each tool has a different purpose, and together they allow an analyst to work with data from multiple sources.
This article explains why Data Analysis is an excellent career option, what students can learn in a Data Analysis Course in Chandigarh, and how Excel, SQL, and Python can help build a successful career in analytics.
What Is Data Analysis?
Data Analysis is the process of examining raw data to find useful information and support better decision-making.
Raw data is often unorganized and difficult to understand. For example, imagine a company has a dataset containing 100,000 customer transactions. The dataset may contain information such as:
-
Customer Name
-
Product Name
-
Product Category
-
Order Date
-
Sales Amount
-
Quantity
-
City
-
Region
-
Payment Method
Looking at thousands of rows manually would be extremely difficult. A Data Analyst uses tools such as Excel, SQL, and Python to clean and analyze this information.
After analyzing the data, the analyst may answer important business questions such as:
-
Which products generate the highest sales?
-
Which region has the most customers?
-
What are the monthly sales trends?
-
Which customers purchase frequently?
-
Which product category is underperforming?
-
During which months does the company generate the highest revenue?
The answers to these questions help organizations make better decisions.
For example, if analysis shows that sales are increasing in one particular region, a company may decide to invest more in marketing in that region. Similarly, if a product has very low sales, the company may investigate the reason and improve its strategy.
This is the power of Data Analysis.
Why Learn Data Analysis in 2026–27?
The world is becoming increasingly data-driven. Businesses are no longer making important decisions only based on assumptions or personal opinions. Instead, organizations are using data to understand what is happening and what actions they should take.
Almost every industry generates and uses data.
Industries Using Data Analysis
Data Analysts can work in many industries, including:
Banking and Finance
Banks analyze customer transactions, loan data, fraud patterns, and financial performance.
E-Commerce
Online shopping companies analyze customer behavior, products, sales, and website performance.
Healthcare
Healthcare organizations analyze patient records, treatments, hospital performance, and operational data.
Marketing
Marketing teams analyze campaign performance, customer engagement, website traffic, and conversion rates.
Education
Educational institutions can analyze student performance, attendance, and academic results.
Manufacturing
Manufacturing companies analyze production data, supply chains, equipment performance, and product quality.
Information Technology
Technology companies analyze application performance, user behavior, and business metrics.
Because data is generated everywhere, professionals who know how to work with data can find opportunities across multiple industries.
A strong Data Analysis course in 2026–27 should focus on practical skills instead of only theoretical knowledge. Students should learn how to work with real datasets and solve business problems.
Data Analysis Course in Chandigarh
Chandigarh and the Tricity region provide opportunities for students interested in technology, IT, business, and analytics. A Data Analysis Course in Chandigarh can be suitable for:
-
College students
-
Fresh graduates
-
Working professionals
-
Career changers
-
Business professionals
-
IT professionals
-
Beginners interested in technology
One of the biggest advantages of learning Data Analysis is that students from different educational backgrounds can enter the field.
You do not necessarily need to be an advanced programmer to begin learning Data Analysis. Beginners can start with Excel and gradually move toward SQL and Python.
A structured learning path can look like this:
Excel → SQL → Python → Data Visualization → Statistics → Projects
This approach allows students to gradually develop their skills.
Learn Microsoft Excel for Data Analysis
Microsoft Excel is often the first tool students should learn when starting their Data Analysis journey.
Excel is used by businesses worldwide for managing and analyzing data. It is especially useful for beginners because it provides a visual and user-friendly environment.
An analyst can use Excel to:
-
Organize data
-
Clean data
-
Perform calculations
-
Identify trends
-
Create PivotTables
-
Build charts
-
Create dashboards
-
Generate business reports
Important Excel Topics for Data Analysis
A professional Data Analysis course should cover the following Excel concepts.
Data Entry and Formatting
Students should first understand how to organize information in a structured format.
This includes:
-
Rows and columns
-
Tables
-
Data types
-
Number formatting
-
Date formatting
-
Text formatting
Proper formatting makes data easier to understand and analyze.
Sorting and Filtering
Sorting allows users to arrange data.
For example, sales data can be sorted from highest to lowest.
Filtering allows users to focus on specific information.
For example, a company may want to see sales information only for Chandigarh or only for a specific product category.
Excel Formulas and Functions
Excel provides many formulas that are useful for Data Analysis.
Important examples include:
-
SUM
-
AVERAGE
-
COUNT
-
MAX
-
MIN
-
IF
-
SUMIF
-
COUNTIF
-
IFERROR
These functions help analysts perform calculations efficiently.
Lookup Functions
Lookup functions are extremely useful when working with multiple datasets.
Important lookup concepts include:
-
VLOOKUP
-
XLOOKUP
-
INDEX
-
MATCH
For example, an analyst may have one dataset containing customer IDs and another dataset containing customer information. Lookup functions can help combine this information.
Conditional Formatting
Conditional formatting allows users to automatically highlight important values.
For example:
-
High sales can be highlighted.
-
Low performance can be identified.
-
Duplicate values can be detected.
This makes it easier to identify patterns visually.
PivotTables
PivotTables are one of the most powerful Excel features for Data Analysis.
They allow users to summarize large datasets quickly.
For example, a dataset containing thousands of sales records can be summarized by:
-
Region
-
Product
-
Month
-
Category
-
Salesperson
PivotTables help analysts answer business questions quickly.
Excel Dashboards
Students can also learn to create dashboards using:
-
Charts
-
PivotTables
-
Slicers
-
KPIs
An Excel dashboard provides a visual summary of important business information.
Learn SQL for Data Analysis
SQL stands for Structured Query Language.
SQL is used to communicate with databases. Most large organizations store their data in databases instead of Excel files.
For example, an e-commerce company may have databases containing:
-
Customers
-
Products
-
Orders
-
Payments
-
Employees
A Data Analyst uses SQL to retrieve the required information from these databases.
Why SQL Is Important for Data Analysts
Imagine a company has millions of customer transactions.
Opening this information in a spreadsheet may not be practical.
SQL allows an analyst to directly query the database.
For example:
SELECT *
FROM sales;
This retrieves data from a table called sales.
An analyst can also filter the information.
SELECT *
FROM sales
WHERE region = 'Chandigarh';
SQL makes it possible to retrieve only the required information.
Important SQL Topics
A Data Analysis Course should cover topics such as:
-
Databases and Tables
-
SELECT
-
WHERE
-
ORDER BY
-
GROUP BY
-
HAVING
-
Aggregate Functions
-
JOINs
-
Subqueries
-
Common Table Expressions
-
Window Functions
Aggregate Functions
Aggregate functions help perform calculations.
Examples include:
-
SUM()
-
AVG()
-
COUNT()
-
MAX()
-
MIN()
For example:
SELECT SUM(sales_amount)
FROM sales;
This can calculate total sales.
GROUP BY
GROUP BY allows analysts to summarize data by categories.
For example:
SELECT region, SUM(sales_amount)
FROM sales
GROUP BY region;
This helps identify total sales by region.
SQL JOINs
JOINs are extremely important for Data Analysts.
Organizations often store information in multiple tables.
For example:
Customers Table
-
Customer ID
-
Customer Name
-
City
Orders Table
-
Order ID
-
Customer ID
-
Product
-
Amount
SQL JOINs allow analysts to combine information from these tables.
Important JOINs include:
-
INNER JOIN
-
LEFT JOIN
-
RIGHT JOIN
Learning JOINs is essential for working with real-world databases.
Learn Python for Data Analysis
Python is one of the most popular programming languages used in Data Analysis.
Excel is useful for spreadsheet-based analysis, and SQL is useful for databases. Python allows analysts to work with larger datasets, automate repetitive tasks, and perform advanced analysis.
Python is popular because its syntax is relatively simple and it provides powerful libraries.
Important Python Libraries
Pandas
Pandas is one of the most important libraries for Data Analysis.
It allows analysts to:
-
Read CSV files
-
Read Excel files
-
Clean data
-
Handle missing values
-
Filter data
-
Group data
-
Merge datasets
-
Perform calculations
Example:
import pandas as pd

df = pd.read_csv("sales.csv")

print(df.head())
This code reads a dataset and displays the first few rows.
NumPy
NumPy is useful for numerical operations and working with arrays.
It is widely used in Data Science and Machine Learning.
Matplotlib
Matplotlib allows users to create charts such as:
-
Bar charts
-
Line charts
-
Histograms
-
Scatter plots
Seaborn
Seaborn provides advanced statistical visualizations.
It can be useful for:
-
Heatmaps
-
Boxplots
-
Distribution plots
-
Correlation analysis
Python provides much more flexibility compared to spreadsheets when working with complex datasets.
Data Cleaning and Data Preparation
Real-world datasets are rarely perfect.
A dataset may contain:
-
Missing values
-
Duplicate records
-
Incorrect data
-
Inconsistent formats
-
Empty cells
-
Incorrect spelling
Before analyzing the data, an analyst must clean it.
For example:
A city column may contain:
-
Chandigarh
-
chandigarh
-
CHANDIGARH
These values represent the same city but are stored differently.
A Data Analyst must standardize these values.
Data cleaning can include:
-
Removing duplicates
-
Handling missing values
-
Correcting data types
-
Standardizing text
-
Removing unnecessary columns
-
Detecting errors
Data cleaning is one of the most important skills for a professional Data Analyst.
Data Visualization
After analyzing the data, analysts need to communicate their findings clearly.
Data visualization helps transform numbers into understandable charts and graphs.
Common visualizations include:
-
Bar Charts
-
Line Charts
-
Pie Charts
-
Histograms
-
Scatter Plots
-
Heatmaps
-
Box Plots
For example, instead of showing a manager a table containing thousands of rows, an analyst can create a chart showing monthly sales trends.
This makes decision-making easier.
Statistics for Data Analysis
Statistics provides the mathematical foundation for understanding data.
Students do not need to become advanced mathematicians to start Data Analysis, but they should understand important statistical concepts.
These include:
-
Mean
-
Median
-
Mode
-
Range
-
Variance
-
Standard Deviation
-
Correlation
-
Distribution
For example, the mean helps calculate the average value.
Standard deviation helps understand how much values vary.
Correlation helps identify relationships between variables.
Statistics allows analysts to interpret their data more accurately.
Real-World Data Analysis Projects
Projects are extremely important when learning Data Analysis.
Watching tutorials is useful, but practical experience is necessary to develop real skills.
Students should work with multiple datasets and solve business problems.
Examples of Data Analysis projects include:
Sales Analysis Dashboard
Analyze sales data to identify:
-
Total sales
-
Best-selling products
-
Top regions
-
Monthly trends
Customer Analysis
Analyze customer data to understand:
-
Customer behavior
-
Purchase frequency
-
Customer segments
HR Analytics
Analyze employee data to identify:
-
Employee attrition
-
Department performance
-
Salary trends
-
Employee demographics
E-Commerce Analysis
Analyze:
-
Product performance
-
Customer orders
-
Revenue
-
Categories
Marketing Campaign Analysis
Measure:
-
Campaign performance
-
Conversion rates
-
Customer engagement
-
Return on investment
Projects help students create a portfolio that demonstrates their practical abilities.
Career Opportunities After Learning Data Analysis
Learning Excel, SQL, and Python can help students prepare for several analytics-related roles.
Possible career paths include:
Data Analyst
Data Analysts collect, clean, analyze, and visualize data.
Business Analyst
Business Analysts use data and business knowledge to improve processes and solve business problems.
BI Analyst
Business Intelligence Analysts create reports and dashboards to help organizations make decisions.
Reporting Analyst
Reporting Analysts create regular reports and analyze business performance.
Operations Analyst
Operations Analysts analyze processes and operational data to improve efficiency.
Junior Data Scientist
With additional knowledge of Machine Learning and Statistics, students can further move toward Data Science roles.
Why Practical Training Is Important
Learning theory alone is not enough to become a successful Data Analyst.
Students should practice regularly.
A good learning program should include:
-
Practical assignments
-
Real-world datasets
-
Case studies
-
Business problems
-
Mini projects
-
Major projects
For example, instead of simply learning the SQL JOIN concept, students should practice using JOINs on real customer and sales datasets.
Similarly, instead of only learning Python syntax, students should use Python to clean and analyze a real dataset.
Practical learning develops problem-solving skills.
Recommended Learning Path for Beginners
Beginners can follow this roadmap:
Step 1: Learn Excel
Start with:
-
Basic Excel
-
Formulas
-
Functions
-
PivotTables
-
Charts
-
Dashboards
Step 2: Learn SQL
Then learn:
-
SELECT
-
WHERE
-
GROUP BY
-
Aggregate Functions
-
JOINs
-
Subqueries
Step 3: Learn Statistics
Understand:
-
Mean
-
Median
-
Standard Deviation
-
Correlation
Step 4: Learn Python
Focus on:
-
Python basics
-
Pandas
-
NumPy
-
Data Cleaning
-
Data Visualization
Step 5: Build Projects
Create projects using:
-
Excel
-
SQL
-
Python
Step 6: Build a Portfolio
A portfolio can demonstrate your skills to potential employers.
Skills Required to Become a Data Analyst
A successful Data Analyst should develop a combination of technical and analytical skills.
Technical skills include:
-
Excel
-
SQL
-
Python
-
Data Visualization
-
Statistics
Other important skills include:
-
Problem-solving
-
Communication
-
Business understanding
-
Critical thinking
-
Attention to detail
Data Analysis is not only about writing code.
A great analyst must understand the business problem and communicate insights clearly.
Future Scope of Data Analysis
The future of Data Analysis remains closely connected with business intelligence, automation, cloud platforms, and Artificial Intelligence.
AI tools are making some data-related tasks faster, but businesses still need professionals who can:
-
Understand business problems
-
Validate data
-
Ask the right questions
-
Interpret results
-
Identify meaningful insights
-
Communicate recommendations
Therefore, learning strong fundamentals remains extremely important.
Excel, SQL, and Python continue to form a strong technical foundation for learners entering analytics.
Students who combine these skills with data visualization, statistics, and business knowledge can develop a strong profile for analytics-related careers.
Conclusion
A Data Analysis Course in Chandigarh for 2026–27 can provide an excellent opportunity for students and professionals who want to develop practical, industry-relevant skills.
The best way to begin is by building strong fundamentals.
Microsoft Excel helps students understand spreadsheets, calculations, PivotTables, and dashboards. SQL helps analysts retrieve and analyze information stored in databases. Python provides powerful capabilities for data cleaning, automation, analysis, and visualization.
Together, these three technologies provide a strong foundation for a career in Data Analysis.
However, simply completing a course is not enough. Students should focus on practical learning and regular practice. Working with real datasets, solving business problems, and creating projects can help learners develop the confidence required for professional roles.
A successful Data Analyst is someone who can take raw and complex data and transform it into meaningful information.
The recommended learning journey is simple:
Learn the fundamentals → Practice regularly → Work with real datasets → Build projects → Create a portfolio → Prepare for interviews
For anyone interested in starting a career in analytics, learning Excel, SQL, and Python can be an excellent first step. With consistent practice and practical project experience, learners can prepare themselves for opportunities in the growing world of data and analytics in 2026–27 and beyond.


Comments (0)
No comments yet. Be the first to share your thoughts!