


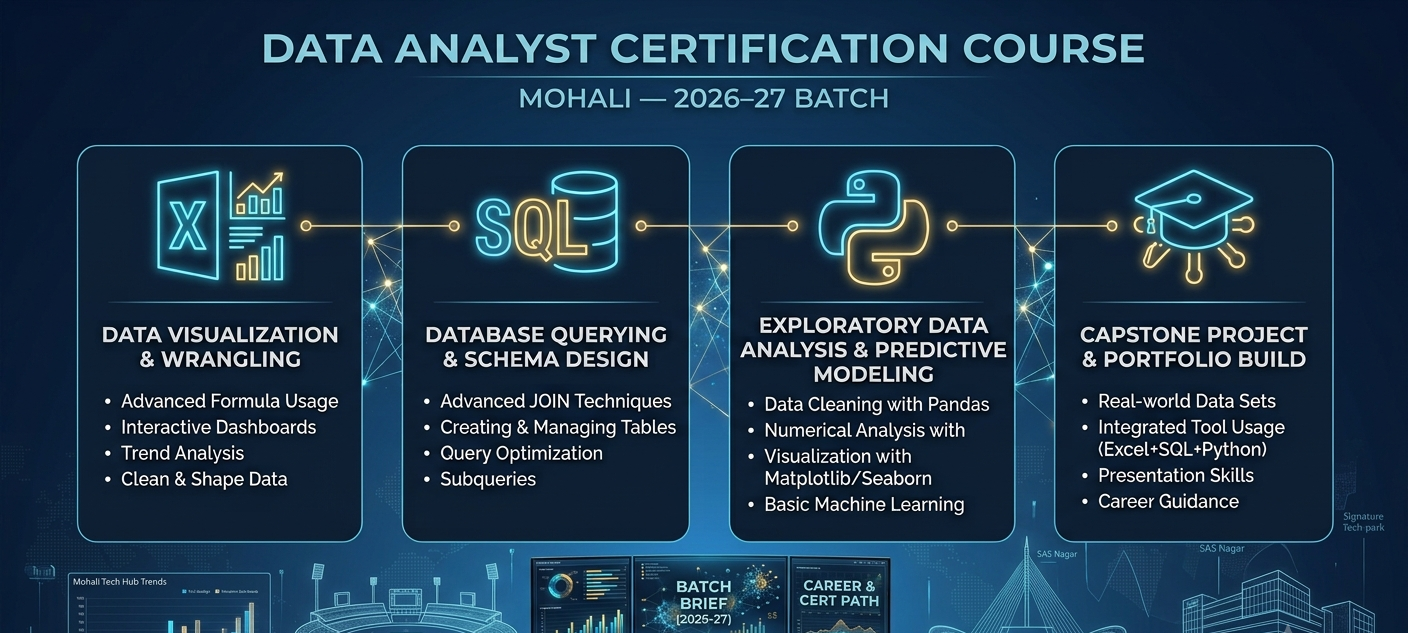
Data Analyst Certification Course in Mohali — 2026–27 Batch
Introduction
In today's digital world, data has become an important part of almost every business and industry. Companies collect information from customers, websites, mobile applications, sales transactions, social media, marketing campaigns, financial systems, and daily business operations. However, having a large amount of data is not enough. Organizations need skilled professionals who can understand this data, identify useful patterns, and transform raw information into meaningful insights.
This is where Data Analysts play an important role.
A Data Analyst works with data to answer important questions, identify trends, measure business performance, and support better decision-making. For example, a company may want to understand why sales are decreasing, which products are performing best, which customers generate the most revenue, or which marketing campaign is delivering better results. A Data Analyst can use different tools and techniques to find answers to these questions.
The Data Analyst Certification Course in Mohali — 2026–27 Batch is designed for students, graduates, working professionals, and beginners who want to develop practical skills in the field of Data Analytics. The course focuses on building a strong foundation in important tools such as Microsoft Excel, SQL, Python, Data Cleaning, Data Visualization, Statistics, and Project Development.
The objective is not simply to teach software tools. A complete Data Analyst learning journey should help students understand how to work with real-world data and solve practical business problems.
What Is Data Analytics?
Data Analytics is the process of collecting, cleaning, organizing, analyzing, and interpreting data to discover useful insights.
Raw data is often difficult to understand. Imagine a company has thousands of records containing information about:
-
Customers
-
Products
-
Sales
-
Regions
-
Orders
-
Revenue
-
Dates
Looking at thousands of rows manually would be difficult and time-consuming.
A Data Analyst uses tools and techniques to organize and analyze this information.
For example, an analyst may answer questions such as:
-
Which product has generated the highest sales?
-
Which city has the highest number of customers?
-
What are the monthly sales trends?
-
Which product category is underperforming?
-
Which customers purchase frequently?
The answers to these questions can help businesses make informed decisions.
Data Analytics therefore combines technology, analytical thinking, problem-solving, and business understanding.
Why Choose a Data Analyst Certification Course in 2026–27?
The business world is increasingly becoming data-driven.
Organizations use data to understand their customers, improve operations, measure performance, and identify growth opportunities.
Data is generated across multiple industries, including:
-
Information Technology
-
Banking
-
Finance
-
Healthcare
-
E-Commerce
-
Retail
-
Marketing
-
Education
-
Manufacturing
-
Logistics
As digital platforms continue to generate information, the ability to work with data can be a valuable professional skill.
The 2026–27 batch can help learners focus on building practical skills rather than only learning theoretical concepts.
Students should understand how to:
-
Work with datasets
-
Clean data
-
Analyze information
-
Query databases
-
Create visualizations
-
Identify business insights
-
Develop projects
Practical knowledge can help learners build confidence and demonstrate their abilities through projects and portfolios.
Who Can Join the Data Analyst Certification Course?
The course can be suitable for learners from different educational and professional backgrounds.
It may be useful for:
-
College students
-
Fresh graduates
-
Working professionals
-
Career changers
-
IT professionals
-
Business professionals
-
Beginners interested in Data Analytics
Students do not necessarily need advanced programming knowledge before starting.
A structured learning approach can begin with beginner-friendly tools such as Excel and gradually move toward SQL and Python.
A recommended learning sequence is:
Data Fundamentals → Excel → SQL → Python → Data Cleaning → Visualization → Statistics → Projects
This step-by-step approach can make learning more organized and easier to understand.
Microsoft Excel for Data Analysis
Microsoft Excel is one of the most widely used tools for business reporting and data analysis.
It provides an excellent starting point for beginners because it allows users to work with data in a visual spreadsheet environment.
Excel can be used for:
-
Organizing data
-
Cleaning data
-
Performing calculations
-
Creating reports
-
Building charts
-
Developing dashboards
Excel Fundamentals
Students can begin by learning:
-
Rows and columns
-
Worksheets
-
Data types
-
Tables
-
Formatting
-
Cell references
Understanding these basics is important before working with larger datasets.
Formulas and Functions
Excel provides many useful functions for Data Analysis.
Important functions can include:
-
SUM
-
AVERAGE
-
COUNT
-
COUNTA
-
MAX
-
MIN
-
IF
-
SUMIF
-
COUNTIF
-
IFERROR
These functions help analysts perform calculations efficiently.
Lookup Functions
Lookup functions can be useful when information is stored across multiple tables.
Students may learn:
-
VLOOKUP
-
XLOOKUP
-
INDEX
-
MATCH
These functions can help connect related datasets.
PivotTables and Dashboards
PivotTables allow analysts to summarize large datasets.
For example, sales information can be summarized by:
-
Product
-
Region
-
Category
-
Month
Charts and dashboards can then help visualize the results.
Excel provides a strong foundation for understanding business data.
SQL for Database Analysis
SQL stands for Structured Query Language.
SQL is used to retrieve and analyze information stored in databases.
Large organizations often store information in multiple database tables.
For example, an e-commerce company may have separate tables for:
-
Customers
-
Orders
-
Products
-
Payments
A Data Analyst can use SQL to retrieve information from these tables.
Basic SQL Skills
Students can learn:
-
SELECT
-
WHERE
-
ORDER BY
-
LIMIT
These commands help retrieve and filter data.
Aggregate Functions
Aggregate functions are used to summarize information.
Examples include:
-
SUM()
-
AVG()
-
COUNT()
-
MAX()
-
MIN()
These functions can help calculate total sales, average values, or the number of customers.
GROUP BY and HAVING
GROUP BY allows analysts to group information.
For example, an analyst can calculate total sales for each region.
HAVING can be used to filter grouped data.
SQL JOINs
JOINs are extremely important when working with multiple tables.
Students can learn:
-
INNER JOIN
-
LEFT JOIN
-
RIGHT JOIN
JOINs help analysts combine related information.
Advanced SQL Concepts
As students progress, they may also learn:
-
Subqueries
-
CASE statements
-
Common Table Expressions
-
Window functions
These concepts can help solve more complex data problems.
Python for Data Analysis
Python is a popular programming language used in Data Analysis, automation, Data Science, and Artificial Intelligence.
Python allows analysts to work with large datasets and automate repetitive processes.
Students can begin with Python fundamentals, including:
-
Variables
-
Data types
-
Lists
-
Dictionaries
-
Conditions
-
Loops
-
Functions
After learning the basics, students can explore Python libraries used for Data Analysis.
Pandas
Pandas is one of the most important libraries for Data Analysts.
It can be used to:
-
Read CSV files
-
Read Excel files
-
Explore datasets
-
Filter data
-
Select columns
-
Handle missing values
-
Remove duplicates
-
Group information
-
Merge datasets
NumPy
NumPy is useful for numerical operations and working with arrays.
It provides a strong foundation for many data-related Python libraries.
Matplotlib and Seaborn
These libraries can be used to create visualizations.
Examples include:
-
Bar charts
-
Line charts
-
Histograms
-
Scatter plots
-
Box plots
-
Heatmaps
Python provides flexibility and helps analysts automate tasks that may be time-consuming when performed manually.
Data Cleaning and Data Preparation
One of the most important responsibilities of a Data Analyst is preparing data for analysis.
Real-world data may contain problems such as:
-
Missing values
-
Duplicate records
-
Incorrect values
-
Empty cells
-
Inconsistent text
-
Incorrect data formats
For example, a dataset may contain:
-
Mohali
-
mohali
-
MOHALI
These values represent the same location but may need to be standardized before analysis.
Students can learn how to:
-
Identify missing values
-
Handle missing information
-
Remove duplicates
-
Correct data types
-
Standardize text
-
Identify unusual values
-
Prepare datasets for analysis
Good analysis depends on good-quality data.
Therefore, data cleaning is an essential part of the complete analytics workflow.
Data Visualization and Reporting
After analyzing data, an analyst needs to communicate the results clearly.
Large tables of numbers can be difficult to understand.
Data visualization helps transform information into charts and reports.
Important visualizations include:
-
Bar charts
-
Line charts
-
Pie charts
-
Histograms
-
Scatter plots
-
Box plots
-
Heatmaps
Different charts are useful for different purposes.
For example:
-
Bar charts compare categories.
-
Line charts show trends over time.
-
Scatter plots identify relationships.
-
Histograms show data distributions.
Students should also learn how to select the appropriate visualization based on the data and business question.
Good visualization helps communicate complex information in a simple way.
Statistics for Data Analysts
Statistics provides an important foundation for understanding data.
Students can learn important concepts such as:
-
Mean
-
Median
-
Mode
-
Range
-
Variance
-
Standard deviation
-
Correlation
-
Data distribution
For example, the mean helps calculate an average value.
The median can help identify the middle value.
Standard deviation helps understand variation in data.
Correlation can help identify relationships between variables.
Students should focus on understanding how these concepts are used in practical Data Analysis.
Practical Projects and Real-World Learning
Projects are an important part of developing Data Analysis skills.
Learning theory alone may not be enough.
Students should work with real-world datasets and solve practical problems.
Examples of projects include:
Sales Analysis Project
Students can analyze:
-
Total sales
-
Monthly revenue
-
Product performance
-
Regional performance
Customer Analysis Project
Students can explore:
-
Customer behavior
-
Purchase frequency
-
Repeat customers
-
High-value customers
HR Analytics Project
Students can analyze:
-
Employee data
-
Attrition
-
Departments
-
Salary trends
E-Commerce Analysis
Students can analyze:
-
Orders
-
Customers
-
Products
-
Revenue
-
Categories
Marketing Analysis
Students can measure:
-
Campaign performance
-
Customer engagement
-
Conversion rates
Projects allow learners to apply technical skills to practical situations.
Portfolio Development
A professional portfolio can help learners demonstrate their practical abilities.
Instead of only writing Excel, SQL, or Python on a resume, students can showcase projects where they used these tools.
A portfolio may include:
-
Excel dashboards
-
SQL projects
-
Python analysis projects
-
Data visualization projects
-
Business case studies
For example, a sales analysis project can demonstrate how a learner:
-
Collected or imported the dataset.
-
Cleaned the information.
-
Analyzed sales trends.
-
Identified top products.
-
Created visualizations.
-
Presented business insights.
Projects provide practical evidence of skills.
Career Opportunities After Learning Data Analytics
After developing practical skills, learners can prepare for different analytics-related roles.
Possible roles include:
Data Analyst
A Data Analyst works with datasets to identify trends, patterns, and insights.
Junior Data Analyst
This role may involve supporting senior analysts with data cleaning, reporting, and analysis.
Business Analyst
Business Analysts focus on business problems and may use data to support better processes and decisions.
Reporting Analyst
Reporting Analysts create and maintain reports related to business performance.
BI Analyst
Business Intelligence Analysts work with reporting and visualization to support decision-making.
Operations Analyst
Operations Analysts analyze business processes and operational performance.
Career requirements can vary depending on the organization, location, experience, projects, and technical skills.
Importance of Problem-Solving Skills
Data Analysis is not only about using technical tools.
A Data Analyst should also understand the problem that needs to be solved.
For example, if a company asks:
“Why are our sales decreasing?”
An analyst may investigate:
-
Which products have declining sales?
-
Which regions are affected?
-
When did the decline begin?
-
Are fewer customers making purchases?
-
Are there seasonal patterns?
The analyst uses data to investigate these questions.
The complete process can be:
Understand the Problem → Collect Data → Clean Data → Analyze Data → Visualize Results → Identify Insights → Make Recommendations
This problem-solving mindset is an important part of professional Data Analysis.
Certification and Skill Development
A certification can represent the completion of a structured learning program. However, learners should focus not only on certification but also on developing practical skills.
Employers may evaluate candidates based on:
-
Technical knowledge
-
Projects
-
Problem-solving ability
-
Communication skills
-
Practical experience
Therefore, learners should combine certification with consistent practice and portfolio development.
The real value of learning comes from the ability to apply knowledge to practical problems.
Preparing for Interviews
Students can prepare for analytics interviews by practicing:
-
Excel questions
-
SQL queries
-
Python concepts
-
Data cleaning problems
-
Statistics questions
-
Business case studies
Learners should also be prepared to explain their projects.
Interview questions may include:
-
What problem did your project solve?
-
Which dataset did you use?
-
How did you clean the data?
-
What insights did you discover?
-
Which tools did you use?
The ability to clearly explain analytical work is important.
Future Scope of Data Analytics
Data continues to play an important role across industries.
Modern organizations increasingly use:
-
Business Intelligence
-
Cloud platforms
-
Automation
-
Artificial Intelligence
-
Machine Learning
These technologies are changing the way professionals work with data.
However, strong analytical fundamentals remain important.
Professionals still need to:
-
Understand business problems
-
Validate data
-
Identify useful metrics
-
Interpret results
-
Communicate insights
Data Analytics can also provide a foundation for advanced learning in areas such as:
Business Intelligence → Data Science → Machine Learning → Artificial Intelligence
Learners who develop strong fundamentals can continue expanding their skills as technology evolves.
Why Choose a Structured Learning Approach?
Learning Data Analytics from random tutorials can sometimes create confusion.
Students may learn individual topics but struggle to understand how they connect.
A structured learning approach provides a clearer journey.
For example:
Step 1: Learn Excel
Understand spreadsheets, formulas, PivotTables, and dashboards.
Step 2: Learn SQL
Practice querying databases and combining tables.
Step 3: Learn Python
Perform advanced analysis and automation.
Step 4: Learn Visualization
Create meaningful charts and reports.
Step 5: Build Projects
Apply skills to practical business problems.
Step 6: Build a Portfolio
Demonstrate your practical work.
This structured path helps learners build knowledge step by step.
Conclusion
The Data Analyst Certification Course in Mohali — 2026–27 Batch provides a structured learning opportunity for students and professionals interested in developing Data Analytics skills.
The learning journey can begin with Microsoft Excel, where students learn spreadsheet analysis, formulas, PivotTables, and dashboards. SQL can help learners work with databases and retrieve useful information. Python provides advanced capabilities for data cleaning, analysis, automation, and visualization.
Along with technical tools, learners should develop skills in statistics, business understanding, problem-solving, and communication.
The most important part of becoming a skilled Data Analyst is practical experience. Students should work with datasets, solve real-world problems, build projects, and create a portfolio that demonstrates their abilities.
A successful learning journey can be summarized as:
Learn the Fundamentals → Practice Regularly → Work with Real Data → Build Projects → Develop a Portfolio → Prepare for Career Opportunities
For learners interested in entering the world of analytics, developing strong skills in Excel, SQL, and Python can provide an excellent foundation. With consistent practice, practical projects, and continuous learning, students can prepare themselves for the evolving opportunities in the data-driven world of 2026–27 and beyond.

Comments (0)
No comments yet. Be the first to share your thoughts!